
chart-output-mcp
io.github.lavondev/chart-output-mcp
Render branded chart images (PNG, SVG, WebP, PDF) and KPI cards from a JSON spec or plain data.
Documentation
Chart-Output MCP Server


Render charts as PNG, SVG, WebP, or PDF directly from Claude, Cursor, Windsurf, or any MCP-compatible AI agent.
Ask your AI: "Generate a bar chart showing Q1–Q4 revenue" — it calls Chart-Output and returns the image inline.
What it produces
Ask your AI agent to generate a chart. This is what comes back.
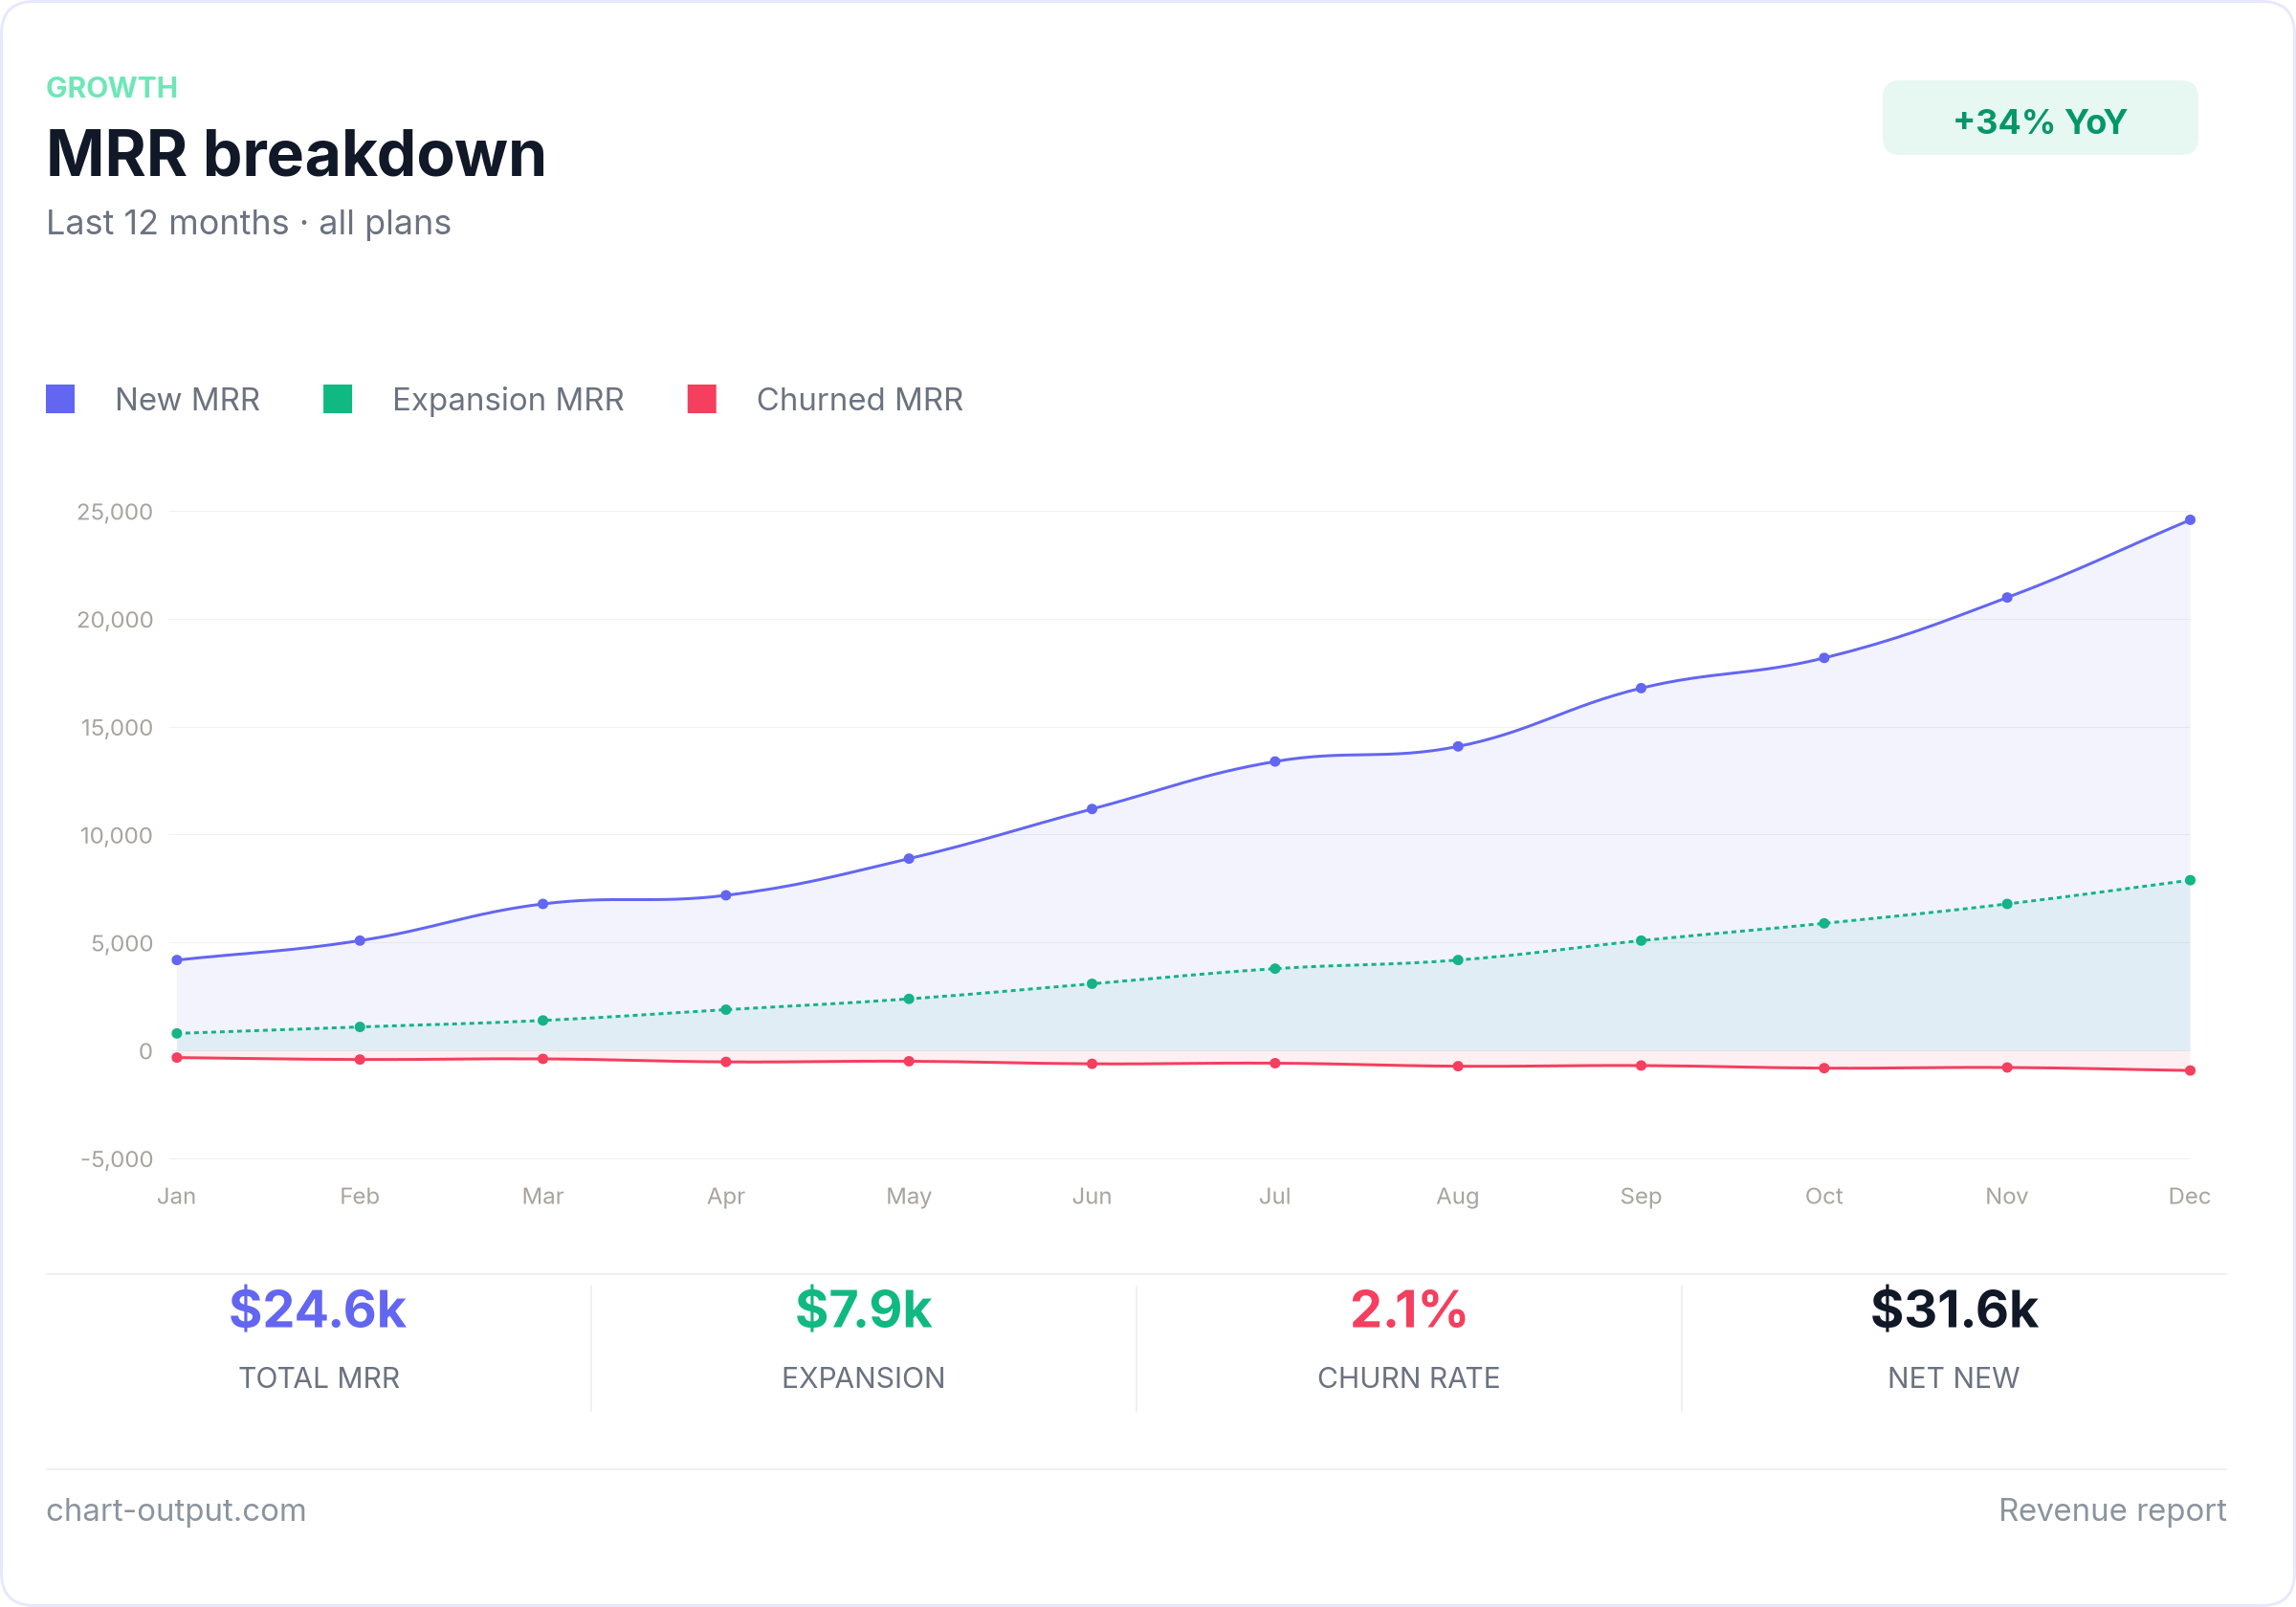
(If the image does not load in your viewer, open the file on GitHub.)
Examples
Ready-to-use chart configs in /examples.
Copy any file, swap in your data, POST to the API.
Examples are 1200 px at scale 1 so they run on a Free key. On Pro or Agency you can set scale to 2. Free renders carry a small watermark.
Install
Add to your mcp.json:
{
  "mcpServers": {
    "chart-output": {
      "command": "npx",
      "args": ["@chartoutput/mcp"],
      "env": {
        "CHART_OUTPUT_API_KEY": "pk_test_YOUR_KEY"
      }
    }
  }
}
Get a free API key at chart-output.com — no credit card required.
Tools
| Tool | Description |
|---|---|
list_chart_output_examples | Shipped example spec ids — use before hand-writing render_card JSON |
get_chart_example | Return full examples/<id>.json text (valid API body shape) |
render_chart | Chart.js-style labels/datasets → inline image. Datasets keep fill, stack, yAxisID, dataset-level type, null gaps and [from, to] floating bars. Optional header, kpiStrip, footer, brand, textScale, annotations, dataLabels, colorblind_safe, alt_text, lang, repair, scale |
render_chart_url | Same as render_chart → public CDN link instead of bytes (also pdf on Pro or Agency) |
render_card | Full card composition JSON → inline image; the spec is POSTed once, exactly as given, to /api/v1/render |
render_card_url | Same full card composition → public CDN link |
render_chart_ai | Natural language + data → image (Pro or Agency plan required). Optional brand |
render_waterfall | "What changed between two periods": a waterfall chart plus a summary of the drivers. States what changed, never why. explain needs Pro or Agency |
list_brand_kits | Saved brand kits on your account. Pass a slug as brand in the render tools |
create_brand_kit_from_url | Draft a brand kit from a website (draft only unless save: true) |
list_gallery_charts | Ready-made chart designs for common business questions, grouped by job. No key needed |
get_gallery_chart | One gallery chart's data shape, sample data and runnable request; can render it in the same call |
MCP resources expose the example files as application/json at chart-output://examples/<id> (e.g. mrr-breakdown), and a field reference at chart-output://reference/request-fields. Prefer get_chart_example or a resource read over guessing the schema.
Gallery charts are not the same as the API's template ids (/api/v1/templates). A name such as mrr-growth can exist in both places and they are different charts. A guide for agents is at chart-output.com/llms.txt.
Example
Once installed, just ask your AI agent:
"Create a line chart showing monthly active users growing from 12k in January to 28k in December"
The agent calls render_chart, render_card, or render_chart_ai and returns
the image directly in chat. No code required. Use render_card for branded dashboard layouts (dark theme, KPI row, footer), render_card_url when you need an openable/shareable link, and render_waterfall to explain a change between two periods.
API Key
- Sign up at chart-output.com
- Go to Dashboard → API Keys → Create key
- Add it to your
mcp.jsonas shown above
Plans and limits
Plans are Free, Pro and Agency. Free plan: 1,000 renders a month, no credit card. Free renders carry a small watermark. See https://www.chart-output.com/pricing for what each plan includes.
The longest edge of an image (max(width, height) × scale) must fit your plan: 1200 px on Free, 3000 px on Pro and Agency. The API accepts width and height up to 4000; the plan decides.
When a call is refused
Errors come back as plain text with the API's own details, so an agent can act on them:
- 402 — the monthly allowance is used up. The text has the reset date and an upgrade link. Do not retry.
- 403 — your plan does not include what the request asked for (for example PDF, a size above your plan's limit, plain-English charts, waterfall explanations). Do not retry the same request.
- 400 — the spec is invalid; every failing field is listed with its path.
- 404 — an unknown
brandslug; the text lists the slugs that exist. - 429 — too many requests (100 per 15 minutes per key). The server waits at most 10 seconds for
Retry-After; if the wait is longer it stops and says how long to wait.
Successful results can also carry a usage line (Usage: 412 of 1,000 renders this period), warnings, and alt text when you ask for alt_text.
Keep labels and every dataset's data the same length. The API only checks this when you set repair ("safe" or "off").
Environment variables
| Variable | Default | Purpose |
|---|---|---|
CHART_OUTPUT_API_KEY | — | Your API key (stdio). |
CHART_OUTPUT_BASE_URL | https://www.chart-output.com | API host, for self-hosting or tests. http is accepted only for localhost and 127.0.0.1. |
CHART_OUTPUT_SITE_URL | https://www.chart-output.com | Site host for the gallery tools (read-only, no key sent). Same rule as above. |
CHART_OUTPUT_TIMEOUT_MS | 35000 | Timeout for renders. |
CHART_OUTPUT_AI_TIMEOUT_MS | 65000 | Timeout for render_chart_ai. A timeout is not retried, so the model is not run twice. |
CHART_OUTPUT_MAX_RETRIES | 2 | Retries for 429 and 502/503/504 and network errors. |
CHART_OUTPUT_RETRY_BASE_MS | 500 | Backoff base. |
PORT | 3000 | HTTP server port. |
MCP_ALLOWED_ORIGINS | * | HTTP server: allowed browser origins, comma separated. |
MCP_ALLOW_SERVER_KEY | unset | HTTP server: set to true to let callers without a key use the server's own CHART_OUTPUT_API_KEY. |
Run it as an HTTP server
Besides stdio, the package contains a stateless Streamable HTTP server (src/http.ts, built to build/http.js):
PORT=3000 node build/http.js
- Endpoint:
POST /mcp./sseand/messagereturn 410. - Send the caller's Chart-Output key as
Authorization: Bearer <key>orx-chart-output-api-key: <key>. - Request bodies up to 2 MB are accepted.
- Do not set
CHART_OUTPUT_API_KEYon a public host. Without a key in the request, tool calls fail with a 401 message. The server's own key is used only whenMCP_ALLOW_SERVER_KEY=true; with that on, anyone who can reach/mcpcan spend your renders. Use it only on a private network. - The plain-English chart tool can take up to 60 seconds, so a serverless function needs a matching time limit (on Vercel,
maxDurationof 60 forsrc/http.ts, if your plan allows it).
Glama
Registry listing and quality card:

Development
npm install
npm test          # builds, then runs the offline tests against a fake API (no key, no network)
npm run smoke     # probes the built server over stdio
Links
@chartoutput/mcpnpm install @chartoutput/mcp